This week is all about hacking. What is hacking? It’s about thinking what the developer didn’t think about and using it to your advantage. You can find bugs in a program, alter the behavior of the program, and then get access to the program. You could also discover vulnerabilities in the configuration settings such as weak passwords and use this to your advantage. Improper input validation can also lead to programs overwriting the stack with user input that can give him or her control of your program.
Recently, there has been a shift in hacking. Before, most attacks came from the internet and targeted a company’s DMZ or border systems (website or email servers). Now, the focus of attacks is on individual users, using techniques like phishing to gain control of an internal users computer to begin an attack on the whole system.
Taking advantage of a vulnerability has two parts. The first part is the vulnerability trigger where the user invokes a software bug that gives control to the user. The second part is the payload, which is the code that performs a desired action after control is obtained – this is usually shell code. One of the common payloads is shell code to run the Windows calculator to demonstrate that control of the system has be obtained.
The second lecture from this week introduced us to the program WinDbg. WinDbg is a debugging program similar to gdb that can be used to step through a program and examine registers and memory.
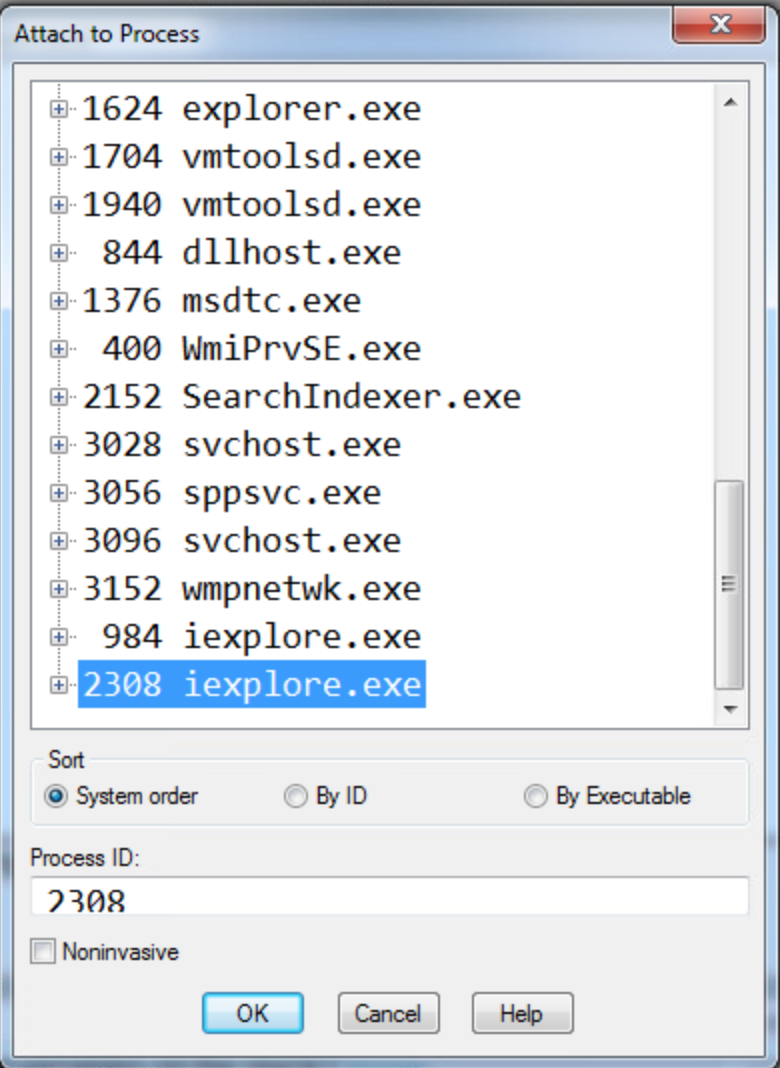
For the first lab, we are instructed to place attach Windbg to the second internet explorer process, set a breakpoint at 54431df0, and then click a link to trigger the breakpoint.
1. What address is FSExploitMe.ocx loaded at?
We can find this by using the list loaded modules command (lmf) to display the addresses for the loaded modules. We can see from the screenshot below that FSExploitMe is loaded at address 54430000.

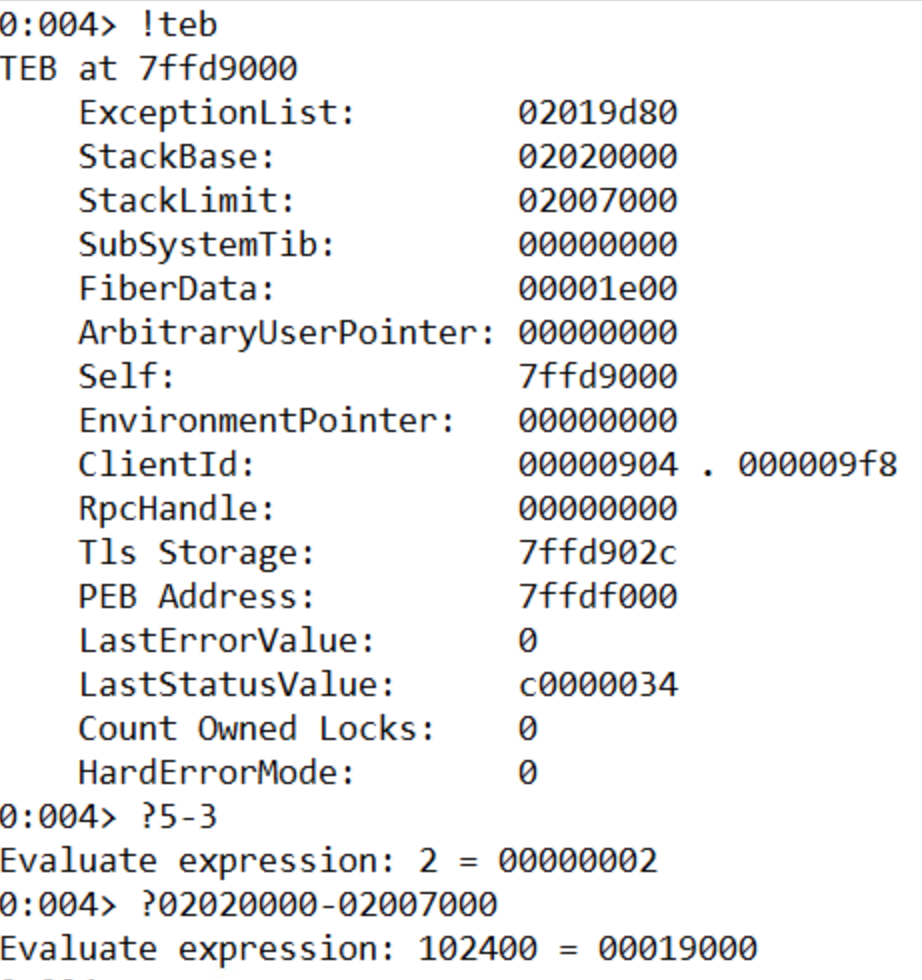
2. How large is the stack?
We can find out the size of the stack by using the !teb command to list information about the stack and then subtracting the Stack Limit from the Stack Base. A cool feature of Windbg is that it can evaluate math operations in the console directly by prefacing the expression with ‘?’. The size of the stack is 19000.
3. What is the starting address of the process heap?
The starting address of the process heap is 2e0000. This can be found by typing the !peb command into the console and looking for the Process Heap label.

4. What is the value of EIP?
The value of EIP is 54431df0. This is where we set the breakpoint.
5. Issue the command “u eip L10” – how much space is allocated for local variables on the stack?
The memory allocated for local variables is subtracted from ESP at the beginning of the function. This is 14h or 20 bytes.

6. Execute 5 instructions with t 5. What is the string pointed to at the top of the stack?
Dumping the unicode text at the ESP pointer after running t 5 shows that the string at the stop of the stack is “FluffyBunniesDontFlapOrQuack”. It’s important to use the poi() function to take the value stored at that address instead of the address itself. As seen below, “du esp” leads to unexpected results. Also, using da instead will be expecting ascii characters and will only list the first character (F) of the unicode string since in ascii when 8 zero bits are encountered, it is interpreted as a 0.

7. Execute 11 instructions with the command “p b”. This instruction is the start of a loop. How many times will this loop run?
This loop will run 10 times. The counter is set to 0Ah, which is 10 in decimal.

8. Execute all instructions up until the functions return value with pt. What is the decimal value returned by the function?
The return value in x86 is store in the EAX register. The 7a69h is 31337 in decimal, or “elite” in l33t sp34k.
After the lab, we covered how to take control of a program by manipulating the stack. We want EIP to point to an address where our code exists. So we need to find how many bytes between our buffer and the return address on the stack. In order to figure out how to find how big the offset it, we can use JavaScript. Using the metasploit pattern variable to overwrite EIP, we can use the byakugan module to determine the length of the offset. Next, we need to position our executable shell code into the memory of the program. One way is to create a string with a bunch of NOP operations, our shell code, then a return address and try to guess the address. But this is not a very reliable method since we’re literally guessing. Another way is to write filler into the stack until the return address, then our shell code. We know that after we return and EIP gets overwritten, ESP points to our shell code. We don’t know the value of ESP but we know that it points to our code. Now we just need to find a jmp ESP instruction anywhere in the code (ffe4) and replace the return address with the address of this instruction. Now, after the function returns, it will start execute our code right off the stack. However, on modern operating systems, this exploit won’t work because because there are protections to prevent code from being executed off the stack.
